We Put 4,096 Live Feature Flags on a Pixel Grid — Using Only Our Public API
How Flaggr's landing-page demo renders a 64×64 grid where every pixel is a real flag, served entirely by the documented core endpoints: flag list, batch evaluation, bulk update, and SSE streaming. With measured latencies, Grafana dashboards, and the security model that makes anonymous writes safe.
Scroll down flaggr.dev and you'll hit a 64×64 pixel grid. Every cell is a real feature flag — px-0 through px-4095 — stored in Neon Postgres, evaluated by the same pipeline your SDKs use, and mutated through the same API endpoints our docs describe. There is no demo backend, no bespoke transport, and no fake telemetry. When you click a pattern, 4,096 real flags flip in one bulk write, and every connected visitor sees the change stream in.
This post is about how we built it, what it costs, and why we deleted the custom API we originally wrote for it.
The constraint: the demo must use the product API
The first version of the grid ran on a purpose-built surface — a compact bitmap endpoint and a custom SSE channel. It was fast (512 bytes for the whole grid) but it proved nothing: a bespoke endpoint can always be fast, because it skips the work a real API does.
So we tore it out. The grid now runs on four documented endpoints:
| Action | Endpoint | Measured |
|---|---|---|
| Bootstrap / poll | GET /api/flags?serviceId=pixel-grid&environment=development&limit=4096&fields=key,enabled | ~28ms warm · 140KB (was 2.3MB — see the optimization pass below) |
| Batch refresh | POST /api/flags/evaluate/batch (4,096 flags) | ~110ms warm · 175KB in / 210KB out |
| Apply pattern | PATCH /api/flags/bulk?summary=true (delta only) | ~460ms · ~50B response |
| Poll, unchanged | GET /api/flags + If-None-Match | 304 · ~15ms · 0 bytes |
| Live updates | GET /api/flags/stream?serviceId=pixel-grid | apply→visible ~1.4s |
The byte counts are the honest trade-off, and they're visible in the demo's own trace view: a flag list returns flag documents, while a batch evaluation returns just {key, value, reason} — what an SDK actually needs at runtime.
The write path: one pattern = one bulk update
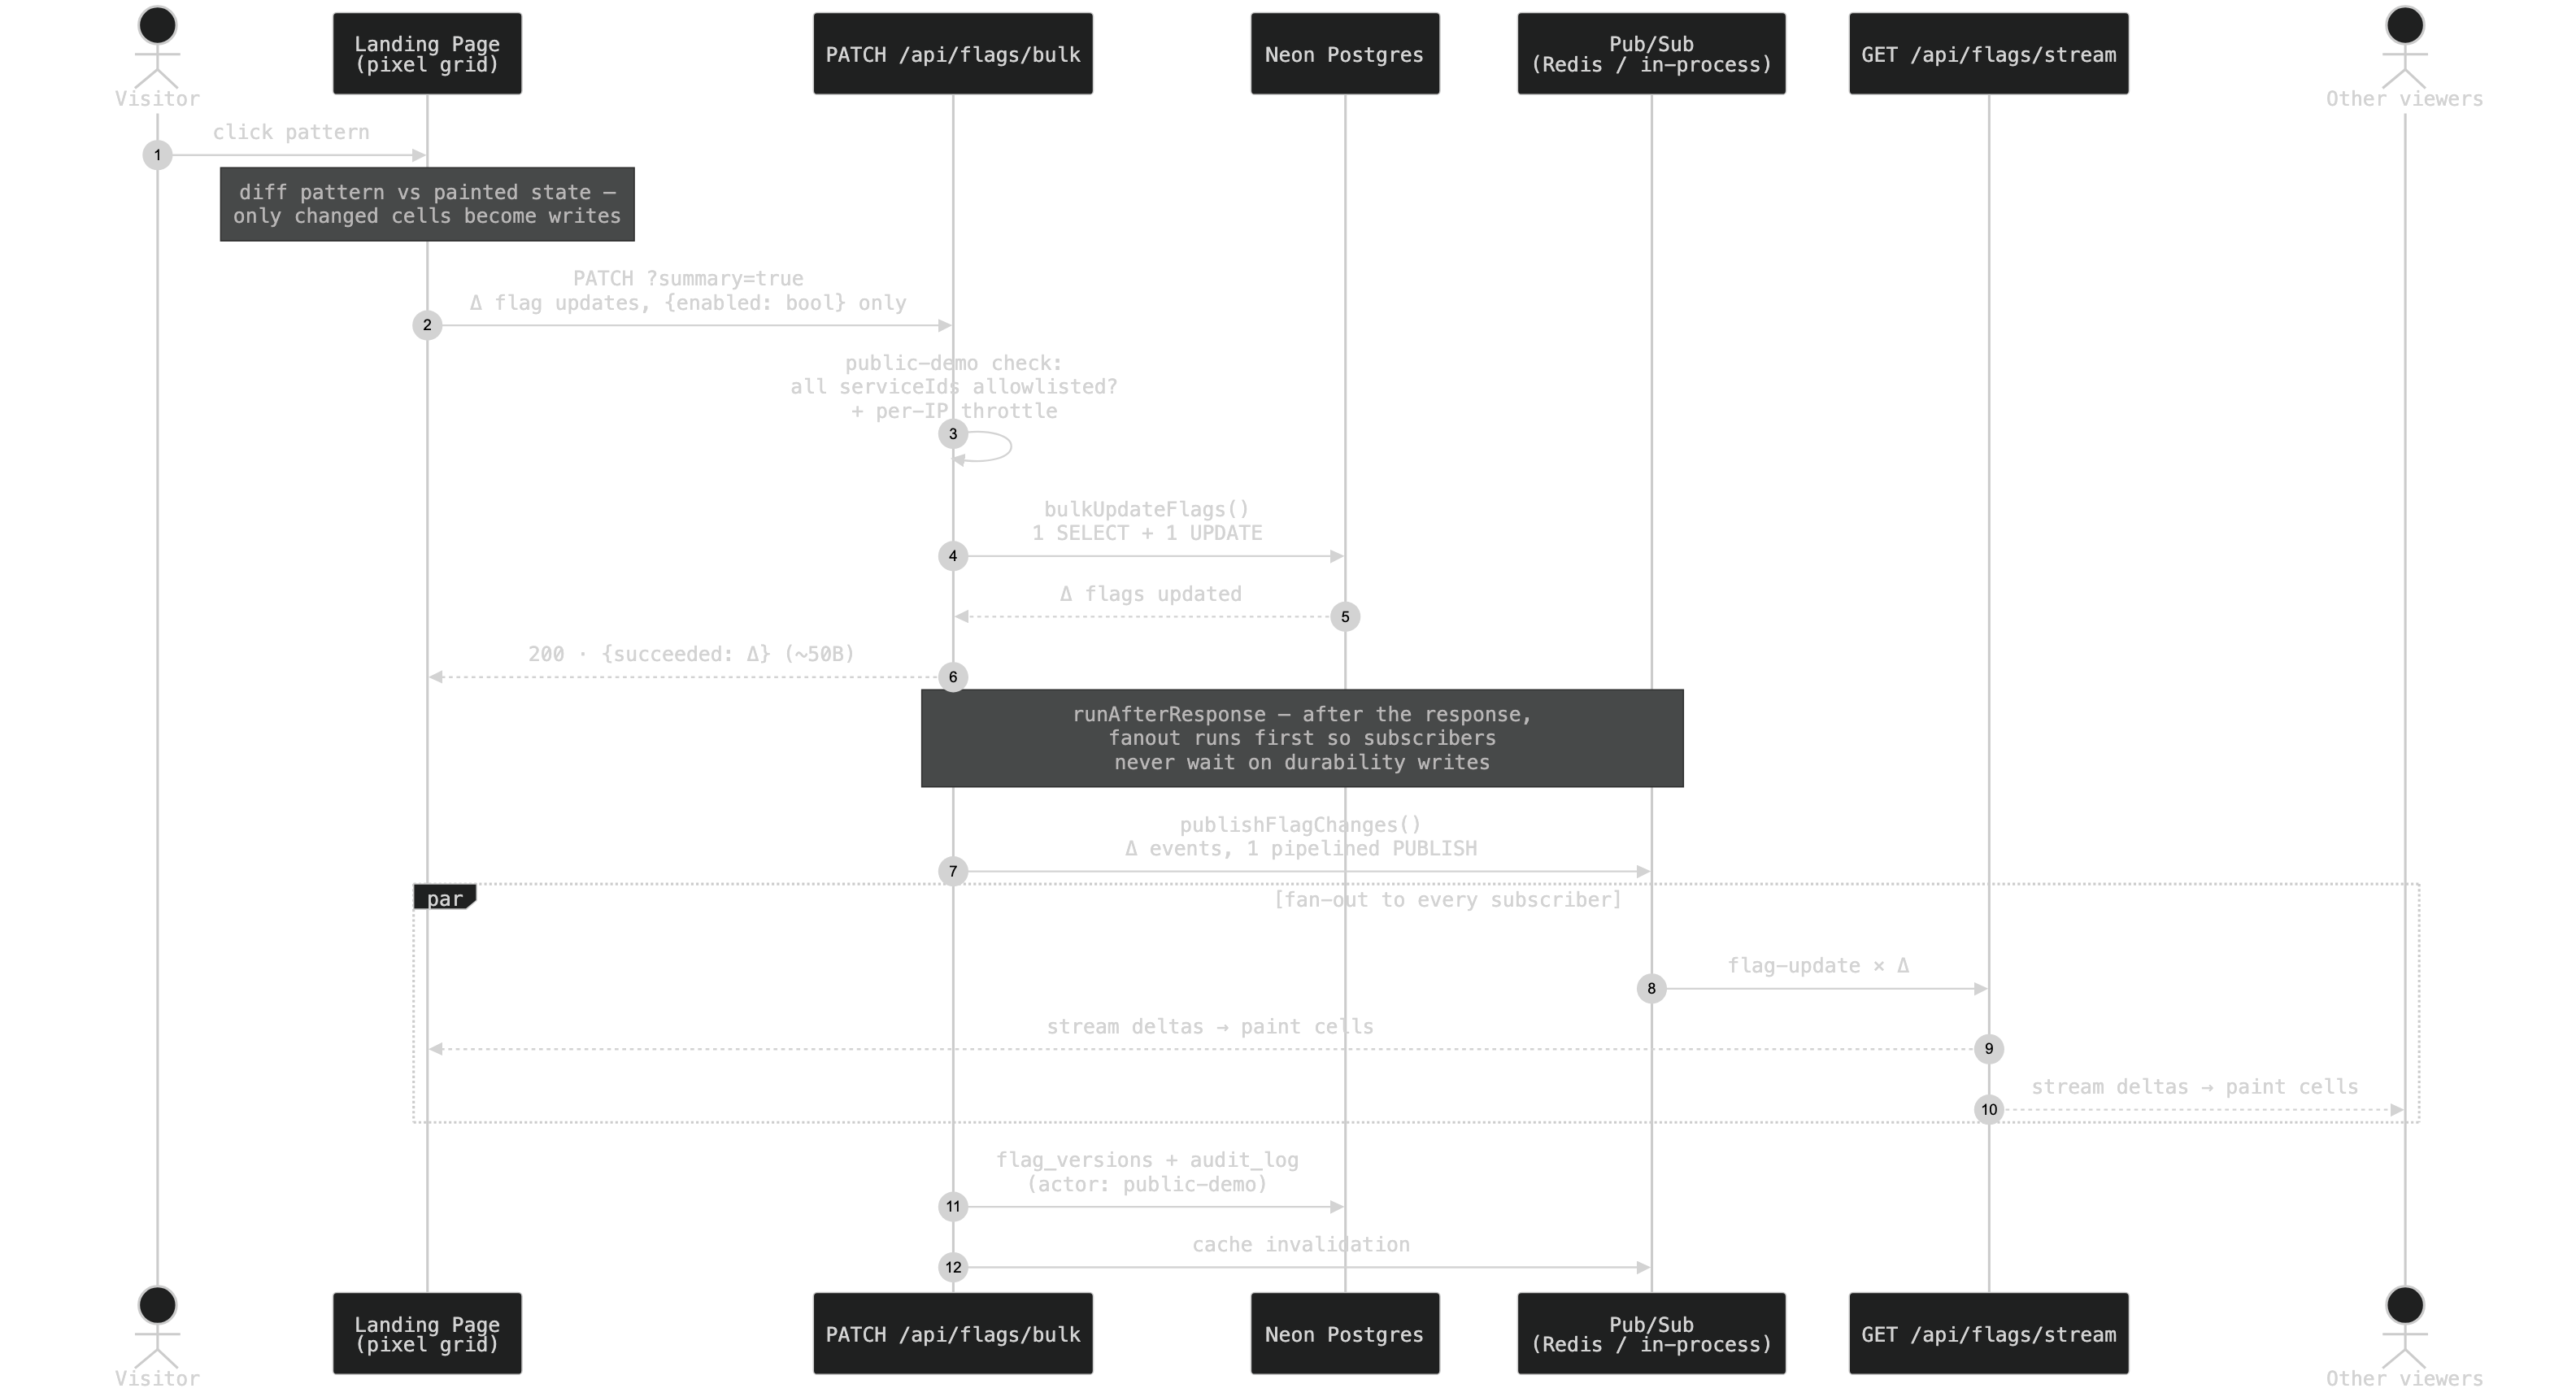
Clicking "Invader" sends a single PATCH /api/flags/bulk with 4,096 {enabled} updates. Server side, that's:
- One
SELECT+ oneUPDATEviabulkUpdateFlags— grouped per (service, environment), not 4,096 round-trips. - Response returns immediately — durability work is deferred via
runAfterResponse. - Fanout publishes first — 4,096
flag-updateevents go out in one pipelined RedisPUBLISHbefore the version-snapshot and audit INSERTs run, so subscribers never wait on durability writes that scale with batch size. (We found that ordering bug because the grid made it visible — the old code published after ~8s of audit writes.) - Every SSE subscriber paints — the update arrives as real per-flag
flag-updateevents carrying the full flag object. No special message types.
The read path: three honest delivery modes
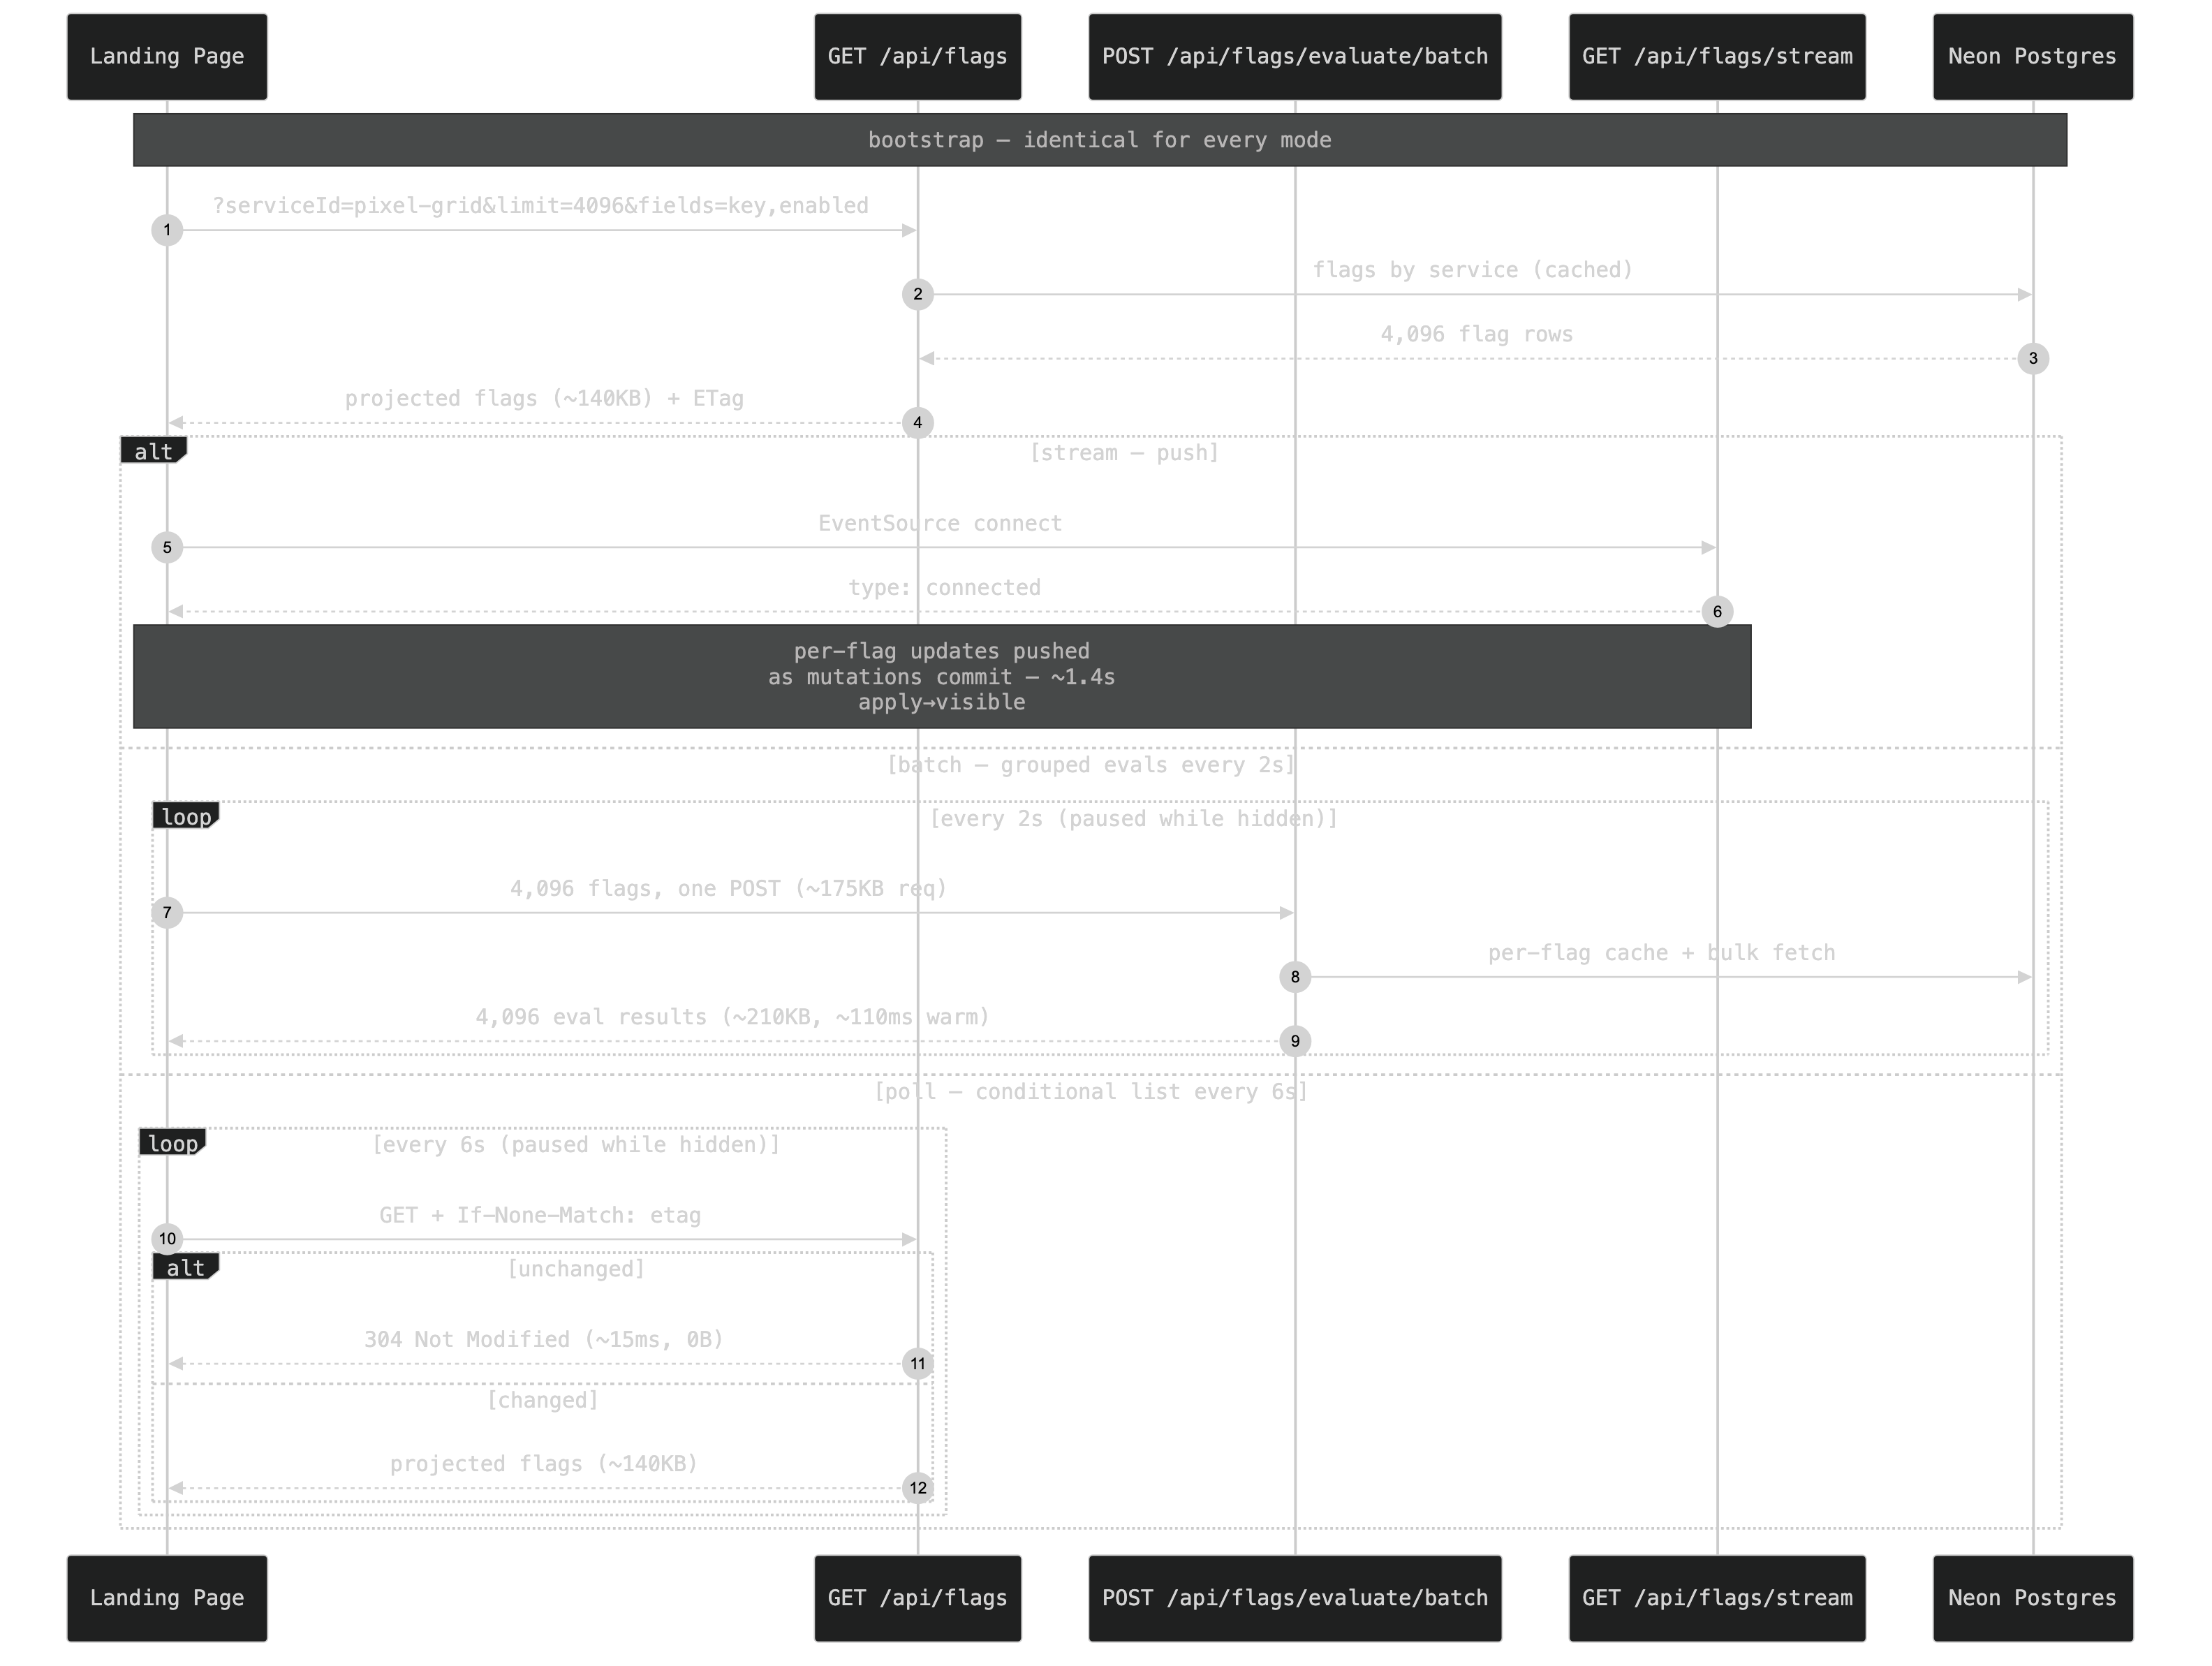
The mode toggle under the grid isn't simulated — it switches the actual transport:
- stream opens
GET /api/flags/stream, the same SSE feed SDKs consume. One connection, updates pushed per flag as they commit. - batch · 2s calls
POST /api/flags/evaluate/batchwith all 4,096 keys every two seconds — the SDK's grouped-eval path at full scale. - poll · 6s re-runs
GET /api/flagsevery six seconds — the naive whole-state refresh.
Polling pauses while the tab is hidden, ticks never overlap, and the waterfall trace below the grid records every call with real timings and byte counts — including errors (we've watched it log a cold-start 500 and a 429 from the rate limiter; both stayed in the trace because that's the point).
Anonymous writes, safely
The hard part wasn't throughput — it was letting strangers mutate flags on a public page without weakening the API. The answer is a public demo service allowlist (src/lib/public-demo.ts): pixel-grid is the only service the core endpoints will serve without a project token, and the bypass never crosses service boundaries:
- List/eval/stream: service-scoped bypass only — any other
serviceIdstill requiresprojectId+ a token. - Bulk update: the handler peeks at the request body; the write runs unauthenticated only if every target service is allowlisted. Updates are then force-filtered to
{enabled}— you cannot touch names, targeting rules, or variants through the public path. One write per IP per 2s; audit entries are attributed to apublic-demoactor. - CSRF: skipped only on the all-public path — there's no ambient session to abuse. Mixed requests (any non-demo service) get the full CSRF + write-token requirements.
A bad actor's worst case is defacing a shared demo grid — which is what the grid is for.
Watching it in Grafana
Everything above is instrumented with the same metrics the platform emits for real traffic. We added a dedicated dashboard — observability/grafana/dashboards/pixel-grid-demo.json — tracking the demo surface:
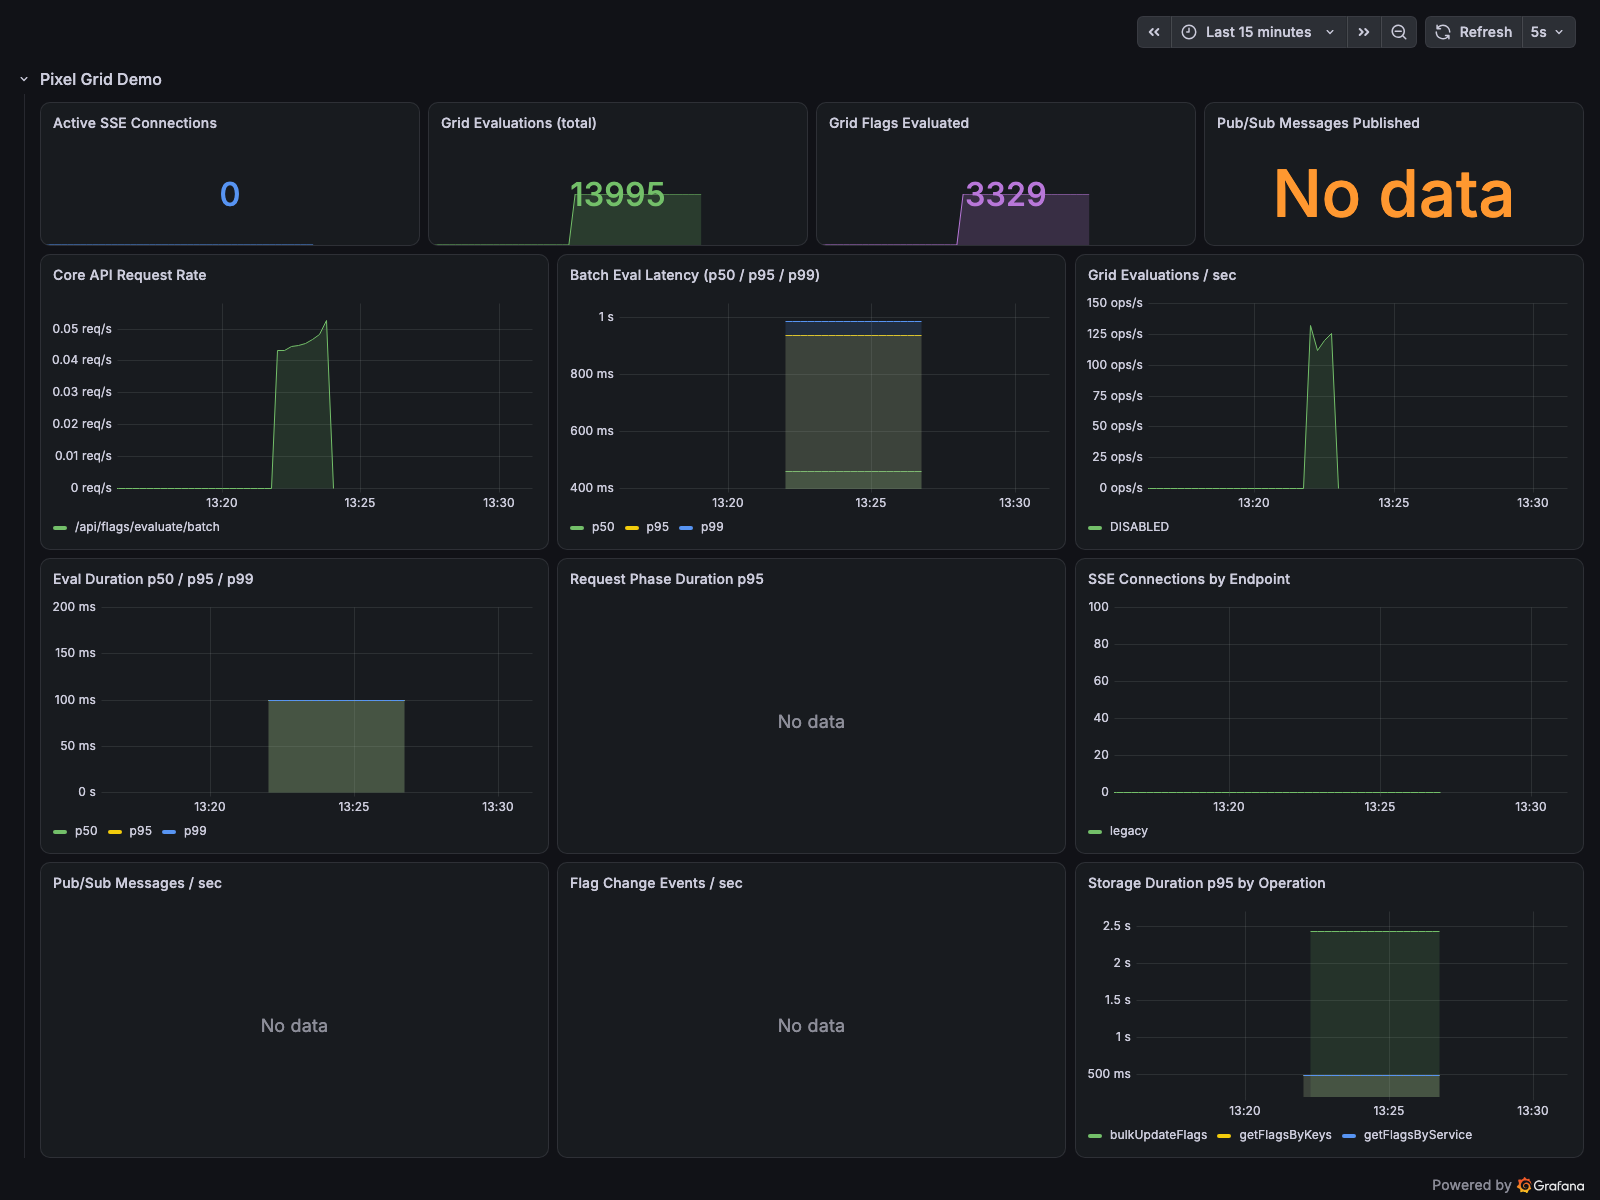
What you're seeing in that capture: ~125 grid evaluations/sec during a burst, batch-eval latency p50/p95/p99 hovering ~400–900ms cold and ~110ms warm, bulkUpdateFlags at ~2.5s p95 in storage, and the SSE connection gauge tracking live subscribers. Panels include:
flaggr_evaluations_total{flag_key=~"px-.*"}— grid eval throughput by reasonflaggr_http_request_duration_seconds— per-route latency for the four endpointsflaggr_sse_active_connections{endpoint="legacy"}— concurrent stream subscribersflaggr_pubsub_messages_total{direction}— fanout volume (4,096 messages per apply)flaggr_storage_duration_seconds{operation}— where writes actually spend timeflaggr_phase_duration_seconds{phase}— auth/storage/eval breakdown per request
The stack is Mimir + Grafana via OpenTelemetry (observability/docker-compose.yml brings it up locally); the same instruments ship to Grafana Cloud in production.
What the grid actually proved
Building this on the real API surface flushed out genuine platform bugs, not demo bugs:
- Batch eval didn't record phase timings — the single-eval route did; now both do.
- Pub/sub silently dropped messages without Redis — dev and single-instance deploys got nothing. There's now an in-process fallback bus on
globalThis(it has to be process-global because dev bundlers instantiate modules per route). - Fanout waited on durability — bulk updates published to subscribers after thousands of version/audit inserts. Reordered; apply→visible went from ~8s to ~1.4s.
- Concurrent auth cold-misses stampeded — coalescing project-access lookups took batch-auth p95 from 451ms to 255ms, and prefetching experiments dropped the rules phase from 299ms to ~1ms.
Post-publish: the e2e optimization pass
Shipping the numbers publicly made the waste obvious, so we did a second pass — this time on requests, not just internals:
- Sparse fieldsets on
GET /api/flags.?fields=key,enabledprojects each flag to the named fields before serialization. For the grid: 2.3MB → 137KB per list call (~10ms warm, vs ~200ms TTFB before). Whitelisted fields; works on authenticated lists too. - Conditional requests. Public demo list responses now carry a weak
ETag(an FNV-1a hash overkey|enabled|updatedAt— ~1ms to compute for 4,096 flags). The poll transport sendsIf-None-Matchand gets a 304 in ~15ms with zero bytes when nothing changed — most ticks are now nearly free. - Summary bulk responses.
PATCH /api/flags/bulk?summary=truereturns{success,total,succeeded,failed}instead of 4,096 flag documents — 2.6MB → ~50B per apply. - Delta writes. The demo diffs the pattern against the painted bitmap and PATCHes only cells that change. Sparse patterns touch ~1–2K cells, so the request body, the SQL write set, and the SSE burst to every subscriber all shrink to the delta. Applying the same pattern twice is now a logged no-op — zero requests.
The waterfall trace shows all of it honestly: poll tick · 304 not modified rows at ~15ms next to the odd cold-list spike, and apply invader → Δ 1,150 flags instead of a flat 4,096. Same product surface — the optimizations are ordinary REST techniques (projection, validators, delta writes) applied to real endpoints.
Try it
The grid is live on the landing page — scroll to "Every pixel is a flag", pick a pattern, and watch the waterfall. Every other visitor sees your apply stream in; you'll see theirs. The endpoints are documented under Public Demo Service — poke them directly if you want; the rate limiter is the only thing standing between you and 4,096 flags.
The whole thing is open source — grid rendering, public-demo gate, dashboard, and all.